L7LINE-07 Visual QC Try the demo
Two models · trained on good bottles only

Every broken
bottle caught.

Two very different machines learned what a good bottle looks like — a classic pattern-matcher (PCA) and a small neural network. Neither ever saw a defect during training. Then 63 defects walked in.

▶ Beat the models See the head-to-head
0defects caught · neural net
0defects caught · PCA
0per bottle

Interactive

Can you beat the models?

Five bottles drawn at random from the real test set both models were judged on. You'll be timed per image — call each one OK or defect as fast as you can, then see how you compare.

The neural net judges a bottle in 30 ms and catches 98.4% of defects. Here's what you're hunting for:

Example of a large break defectLarge breaka big chunk missing from the rim or body
Example of a small break defectSmall breaka small chip or crack, usually at the rim
Example of a contamination defectContaminationdebris or residue sitting on the base

You'll get 5 random bottles from the real test set — some good, some defective. Your timer starts when the first one appears.

§1 · The setup

The data

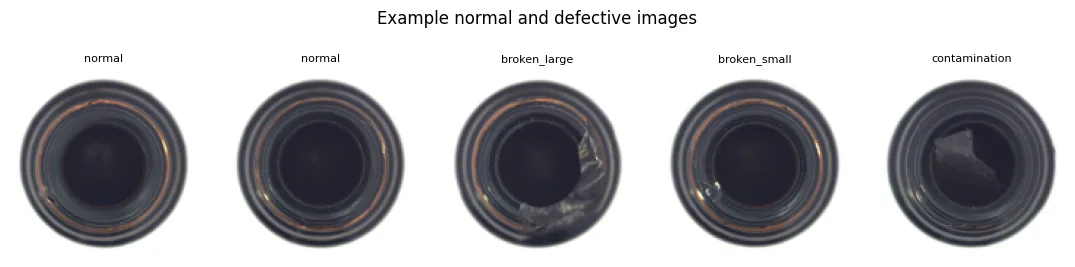
Top-down photos of a glass bottle from the MVTec AD benchmark. Three kinds of defect exist — large breaks, small breaks and contamination — but during training the models only ever see good bottles. That's the whole point: on a real production line you have thousands of photos of good parts and almost none of defects.

Example normal and defective bottle images
Example good bottles and one of each defect type. tap to zoom
splitimagesOKBADrole
train1251250learn what "normal" is
validation41410set the alarm level
test1266363final exam, taken once

Both models use the same split, and each one's alarm level is fixed in advance using only good bottles it hadn't trained on. No defective image ever influences training or the alarm level — the test set is graded exactly once.

§2 · The contenders

Two ways to learn "normal"

Both models work on the same idea: learn to rebuild good bottles, then flag anything they can't rebuild well. A defect is, by definition, something the model has never seen — so its rebuild of a defective photo comes out wrong, and the size of that error is the alarm signal.

Model A · PCA — built by a group member

The pattern-matcher

  1. Even out the photo. Equalize the lighting and lightly blur, so differences in illumination don't look like defects.
  2. Find the 50 strongest patterns shared by all good bottles (this is what PCA does — think of them as 50 "ingredients" of a normal bottle photo).
  3. Rebuild each new photo from only those 50 ingredients, and measure two things: how much the rebuild misses (Q) and how unusual the ingredient mix is ().
  4. Alarm if either number is too high.
The first ten PCA patterns visualized as eigen-images
The model's learned weights, made visible: the first 10 of the 50 patterns (3.3 million numbers in total). Red = brighter than an average bottle, blue = darker. The first two alone carry 37% of what "normal" looks like. tap to zoom
A normal bottle, its PCA reconstruction, and the difference between them
A good bottle (left), what PCA rebuilds from its 50 patterns (middle), and where the rebuild misses (right) — barely anywhere. tap to zoom
Model B · Patch autoencoder — the neural net

The tile inspector

  1. Run five vision filters over the photo — each one makes a different kind of flaw easier to see (tap through them below).
  2. Cut the result into 32×32-pixel tiles, so a small chip can't hide in a big picture.
  3. A small neural network rebuilds each tile, having squeezed it through a tiny 8-number bottleneck — it can only memorise what normal tiles look like.
  4. Score the bottle by its 5 worst tiles. One terrible tile (a break) or several mediocre ones (spread-out dirt) both trip the alarm.
Training curve and layer weight norms of the neural network
The network learning: its rebuild error falls and levels off (left), while the weights in each layer grow and settle as it memorises what normal tiles look like (right). tap to zoom

The five filters, on a real contaminated bottle

Vision channel view

§3 · Results

Head to head

Same photos, same final exam. Here's the whole story in one table:

Neural netPCA
defects caught62 / 63 (98.4%)60 / 63 (95.2%)
good bottles wrongly flagged4 / 63 (6.3%)6 / 63 (9.5%)
breaks caught42 / 42 (all)41 / 42
what it missed1 contamination2 contamination + 1 small break

Defects caught, by type

Neural netPCA

Why the scores work: the two crowds barely touch

Both charts use the same axis: each bottle's score divided by that model's alarm level, so the dashed alarm line sits at 1.0 in both. Good bottles pile up left of the line, defective ones right of it. Where a defect curve leaks left of the line, that's a miss; where a good curve leaks right, that's a false alarm.

Neural net anomaly scores relative to the alarm level
Neural net: only 1 defect leaks left of the line, and 4 good bottles leak right. tap to zoom
PCA anomaly scores relative to the alarm level
PCA: more overlap around the line — its 6 false alarms and 3 misses live there. The worst defects score past 4× the alarm level. tap to zoom

The honest verdict

They're much closer than we expected. The neural net edges it — two more defects caught, two fewer false alarms, and every single break caught — but a well-built PCA gets within a whisker using nothing but classic linear algebra.

The craft matters more than the model class: a plain PCA baseline on the same data caught 51 of 63. The same technique with evened-out lighting, a second alarm dial and sensible settings catches 60 of 63. The gap was never just "deep learning vs PCA" — it was the craft around it.

§4 · Show your work

Where they looked

Neither model just says "defect" — each points at the pixels that set off the alarm. That's what makes the alarms checkable by a human. Flip through the neural net's four outcomes:

The PCA model explains itself the same way — original, rebuild, and where the rebuild missed:

PCA flagged images: original, reconstruction and error heatmap
The first five images PCA flagged: three of its good-bottle false alarms (top), then two large breaks lighting up exactly at the damage. tap to zoom

Which filter raised the neural net's alarm?

Breaking the worst tile's error down by filter shows the golden diff — the difference from an "average good bottle" template — does most of the work, for every defect type.

Share of the alarm signal contributed by each vision filter
Share of the alarm signal by filter, averaged per defect type.
§5 · Deep-dive · the PCA dial

How many patterns does PCA need?

PCA's big setting is how many patterns to keep. Keep too few and it can't rebuild even good bottles — false alarms everywhere. Keep too many and it rebuilds defects too — and the alarm goes quiet. Drag the slider to move along the real curve from the notebook:

0.2 0.6 0.8 1.0 0 100 200 300 400 500 number of patterns kept 95% of the detail

Reading the curve

The first few patterns capture the big shapes, so the curve climbs fast, then flattens as later patterns only add fine detail. The shipped setting of 50 patterns keeps about 88% of the detail in a good-bottle photo; reaching the 95% mark would take about 113. Staying deliberately below that mark is what keeps defects poorly rebuilt — and therefore visible.

Weight of each of the 50 PCA patterns, with the cumulative total
How much each of the 50 patterns matters: the first two dominate, then the weights fall off fast — the red line is the running total. tap to zoom
§6 · The harder product

The transistor line took three tries

Pointed at a fussier product — transistors, whose three metal legs shift slightly from photo to photo — the bottle recipe simply didn't transfer. It took three real attempts before good and defective scores separated. The same score-curve charts tell the story:

Why the third attempt won: PatchCore never rebuilds the image at all. It compares each patch against a memory bank of known-good patches, so ordinary part-to-part variation is recognised instead of punished. The product didn't get worse between attempts — it was just a harder object, and it needed a method built for subtle, local defects.

PatchCore heatmaps for four cut_lead transistor images, all flagged correctly
PatchCore on cut-lead transistors — all four flagged, with the hot spot right at the cut leg. tap to zoom
§7 · Honest assessment

Limitations


Zoomed figure